
Lesson 2.3: Supply and Quantity Supplied
LVL I Answer the following questions as you read:
1. Define supply.
2. What does the law of supply state?
3. What is the difference between a change in supply versus a change in quantity supplied?
4. List the non-price determinants (shifters) of supply and define each one.
5. What impact does input costs have on supply of a good/service?
6. What impact does government regulation and taxes have on supply of a good/service?
7. How do technology investments increase supply?
SSEMI2 Explain how the law of demand, the law of supply, and prices work to determine production and distribution in a market economy.
A. Define the law of supply and the law of demand.
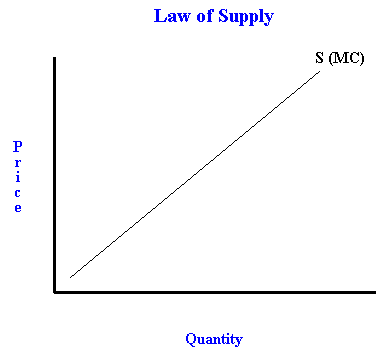
The law of supply says that as price rises the quantity a seller is willing and able to sell will increase. The graph below illustrates this law.
A. Distinguish between supply and quantity supplied, and demand and quantity demanded.
The market supply curve refers to all the quantities of a good, service, or resource sellers are willing and able to sell at each price. The quantity supplied is the amount of a good, service, or resource sellers are willing and able to sell at one specific price. I
SSEMI1 Describe how households and businesses are interdependent and interact through flows of goods, services, resources, and money
Identify the determinants (shifters) of supply (e.g., changes in costs of productive resources, government regulations, number of sellers, producer expectations, technology, and education) and illustrate the effects on a supply and demand graph
The determinants of supply describe the types of changes in a market that will cause the entire supply curve to move to the right or to the left. In other words, all sellers of a good, service, or productive resource will be willing and able to supply more or less of their product at all prices in the market. The shift will cause a change in the equilibrium price and equilibrium quantity in the market.
Change in the costs of productive resources
1. Decrease in costs - If the resources needed to produce a product become more less expensive, sellers will produce more and supply will increase and shift to the right.
2. Increase in costs – If the resources needed to produce a product become more expensive, sellers can produce less and supply will decrease and shift to the right.
Change in Government Regulations
1. Decrease in Regulations - If the government decreases the regulations on sellers in a market, sellers will produce more of the product and supply will shift to the right.
2. Increase in Regulations - If the government increases the regulations on sellers in a market, sellers will produce less of the product and supply will shift to the left.
Change in Number of Sellers
1. Increase in the Number of Sellers - If the number of sellers in the market increases, there will be more producers of the product, supply will increase and shift to the right.
2. Decrease in the Number of Sellers - If the number of sellers in the market decreases, there will be fewer producers of the product, supply will decrease and shift to the left.
Change in Producer Expectations
1. Producers expect the price of their product to fall in the future - If producers expect the price of their product to fall in the future, they will supply more in the present while the market price is higher. This will cause supply to increase and shift to the right.
2. Producers expect the price of their product to rise in the future - If producers expect the price of their product to rise in the future, they will supply less in the present and wait for the price to rise. This will cause supply to decrease and shift to the left.
Change in Technology
1. Production Technology used to produce a product improves - If producers implement new, more efficient technology in the production process, supply will increase and shift to the right.
2. Production Technology, used to produce a product, declines – This scenario is unusual. This could occur if a natural or cyber disaster destroyed access to production technology for a large number of the market’s producers at one time or if a defect in production technology affects many producers all at one time. If producers lose the benefits of production technology, supply decreases and shifts to the left.
Change in Education
1. Education of the workers in a market improves - If many workers in a market improve their education, knowledge, and skills related to the production process, their labor productivity will increase. As a result supply will increase and shift to the right.
2. Education of the workers in a market declines - If the education, knowledge, and skills of many workers in a market declines, their labor productivity will decrease. As a result supply will decrease and shift to the left.
LVL II Application
1. Draw a graph for an increase in supply.
2. Draw a graph for a decrease in supply.
3. Draw a graph that shows an increase in supply with demand staying the same. What happened to the equilibrium price?
4. Draw a supply graph for cars if the price of steel goes down.
5. Draw a supply graph for corn farmers if the government raises taxes on the farmers.
6. Draw a graph that represents an oil shortage
