
Lesson 2.4: Equilibrium and Price Controls
LVL I: As your read answer the questions that follow
1. What is the market equilibrium?
2. Where do you find the market clearing price?
3. What is a government price floor?
4. What is a government price ceiling?
5. What is the result of a price floor?
6. What is the result of a price ceiling?
1. What is the market equilibrium?
2. Where do you find the market clearing price?
3. What is a government price floor?
4. What is a government price ceiling?
5. What is the result of a price floor?
6. What is the result of a price ceiling?
SSEMI2 Explain how the law of demand, the law of supply, and prices work to determine production and distribution in a market economy.
C. Describe the role of buyers and sellers in determining market clearing price (i.e. equilibrium).
The market clearing or equilibrium price is the point of intersection between the market demand curve and market supply curve. This is also the point at which the quantity demanded by consumers is equal to the quantity supplied by producers. Buyers help determine this price by buying a smaller quantity of a good when they view the price charged by sellers as too high. Sellers respond by lowering the price. When buyers perceive a price as lower than equilibrium price, they will buy all of the available items as quickly as possible. Sellers will notice they are having trouble keeping the item in stock or lack the capacity to provide as many services as consumers want. Sellers will raise the price of the product. Through these interactions between buyers and sellers, price will work its way toward equilibrium.
d. Illustrate on a graph how supply and demand determine equilibrium price and quantity.
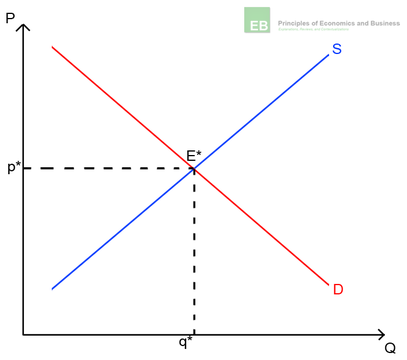
To illustrate how supply and demand determine equilibrium price and quantity, start with a market graph. Draw a horizontal x-axis line and label it “Quantity”. On the left end of your x-axis, draw a vertical line upward to create a y-axis and label it “Price”. Create the demand curve by drawing a downward sloping 45-degree line from the top of the y-axis diagonally toward the right side of the x-axis. Label this curve “Demand”. Create the supply curve by drawing an upward sloping 45-degree line from the bottom of the y-axis diagonally upward away from the origin of your graph. Label this curve “Supply”. Find the place at which the demand curve crosses the supply curve. Draw a dotted horizontal line from the point of intersection to the left until it hits the y-axis. Label this y-axis value as “Pe”. Return to the intersection of the supply and demand curve. Draw a dotted vertical line downward to the x-axis and label this x-axis value as “Qe”. “Pe” is the equilibrium price in the market. “Qe” is the equilibrium quantity in the market as well as the quantity at which the quantity demanded is equal to the quantity supplied. The graph below illustrates the equilibrium in the market.
SSEMI2 Describe how households and businesses are interdependent and interact through flows of goods, services, resources, and money.
G. Explain and illustrate on a graph how prices set too high (e.g., price floors) create surpluses, and prices set too low (e.g., price ceilings) create shortages.
In some limited circumstances, governments or producers will choose to set a market price rather than allow the forces of supply and demand to determine the market price. A price set above equilibrium price is a Price Floor. A price set below equilibrium price is a Price Ceiling. Since these set prices are above or below equilibrium, the quantity supplied will not equal the quantity demanded in the market. Since price floors are above equilibrium, there will be a larger quantity supplied than there is a quantity demanded. When quantity supplied is greater than the quantity demanded, there is a surplus of the product in the market. Since price ceilings are below equilibrium, there will be a larger quantity demanded than there is a quantity supplied. When quantity supplied is less than the quantity demanded, there is a shortage of the product in the market. In the example below, the demand and supply schedule table shows that equilibrium price is $2.00. This price is the one at which the quantity demanded is equal to the quantity supplied. If price is legally set at $1.00, this is a price ceiling. Under this condition, the quantity demanded is greater than the quantity supplied and there is a 100-unit shortage in the market. If price is legally set at $3.00, this is a price floor. Under this condition, the quantity demanded is less than the quantity supplied and there is a 100-unit surplus in the market.
LVL II Application
1. Label a graph with the equilibrium, or market clearing price.
2. Draw a price ceiling graph.
3. Draw a price floor graph.
4. Draw a graph that shows an increase in demand with supply staying the same. What happened to the equilibrium price?
1. Label a graph with the equilibrium, or market clearing price.
2. Draw a price ceiling graph.
3. Draw a price floor graph.
4. Draw a graph that shows an increase in demand with supply staying the same. What happened to the equilibrium price?
